Live Webinar
Register now for the live webinar on Thursday, March 29, 2018 at 2:00pm EDT.
Driving Marketing Performance
Lets take a robust look at the search engine optimization (SEO) elements that CMOs should be keeping an eye on and discover how to set up a dashboard with a storytelling mindset to showcase your SEO program’s results in a manner that commands high-level interest and support.
Learn how to create an SEO dashboard that will captivate and educate CMOs to reveal the true value and
return on investment (ROI) of SEO.
Included in the Ultimate SEO Dashboard for CMOs:
• What CMOs really care about
• SEO questions CMOs need answered
• Storytelling dashboards and data that cuts through the noise
• Ingredients of the Ultimate SEO Dashboard for CMOs
• Sample dashboard charts and graphs
In a data-driven discipline, it’s a good storytelling dashboard that cuts through the noise.
What do CMOs really care about in relation to search and SEO?
Your business’s continuous content investment, site development, and maintenance is hugely important to your
bottom line. Organic search is the primary distribution channel for that content and a critical driver of traffic to
your business’ site.
SEO spending was projected to reach $3 Billion in 2015 and rise 37% to $4.1 Billion by 2019, according to Forrester U.S. Digital Marketing Forecast
https://www.forrester.com/report/US+Digital+Marketing+Forecast+2014+To+2019/-/E-RES116965
Calculating and communicating the impact of SEO traffic and your content’s performance in terms of revenue
and ROI can be difficult for channel-level individuals. As a senior-level marketer, the dashboard is your
storytelling lifeline.
Only 26% of marketers can answer the question “What is marketing’s impact on the business?”
ITSMA/VEM Marketing Performance Management Survey, May 2014
http://www.itsma.com/research/2014-itsma-vem-marketing-performance-management-survey/
The right SEO dashboard translates SEO results into a digestible business leader success story. Building a
custom SEO dashboard is critical to understanding the success story that matters to your company and provides
a real-time view as it happens.
For a CMO, this story isn’t just about search rankings and keywords. It’s about the growth of your company’s
brand, competitiveness, market share, revenue, and overall performance of marketing investments.
For many SEO managers, understanding SEO performance across your site and resultant ROI means producing
data, and lots of it. It’s a data-driven world after all and conventional wisdom – for those who live on data – is
that the more data you can produce, the better.
However, while monitoring and interpreting data is certainly a big part of showing SEO success, a more powerful
way to motivate and persuade decision makers about the impact of SEO and subsequent ROI is to convey these
results as a clearly understandable and digestible storyline. This can be achieved with the right dashboard.
73% of marketers own or share P&L responsibility, according to Gartner: CMO Spend Survey 2015-2016: Digital Marketing Comes of Age
http://gartnerformarketers.com/CMOspend
What do CMOs really care about in relation to search and SEO?
In the digital age, SEO performance is critical to competitiveness and, therefore, marketing success. The answer
to the “how are we doing” question should be instantly apparent when viewing your dashboard. When designing
a dashboard with the CMO in mind, we want to use reverse pyramid-style messaging.
Questions CMOs need answered
• How are we doing?
• Are we doing better than last year?
• Are we ranking for our target terms?
• Are we growing our brand?
• Are we beating the competition?
• Are we growing revenue?
• How are we doing in Germany? (or any other market of concern)
• How can we do better?
Regardless of whether B2B or B2C, performance is ultimately measured at the bottom line, and as we have seen
over the past several years, the CMO and CFO alignment continues to strengthen, while accountability for the
marketer also continues to rise.
As marketers, how can we provide the information our CMOs need to be best prepared for their meetings and
to ensure the sustainability of our SEO programs?
As a precursor to the dashboard, marketers and SEO practitioners must work with executives and tech staff to
answer and address, at least the following three questions:
1. Have you established KPIs?
Is your tracking, measurement and reporting in place?
2. How will you measure success?
What is your site’s monetization strategy (marketing-qualified leads, sales-qualified leads and revenue)?
3. Have you set expectations?
Set realistic timelines and goals; SEO is a marathon not a sprint.
The essential tools of SEO storytelling
To tell these stories, your dashboard must deliver three critical capabilities:
1. Benchmarking
2. Data aggregation
3. Clarity
1. Benchmarking: The ability to show change or improvement over time
Benchmarking gives you a comprehensive view of your site’s current health and production by compiling site
data, financial results and other metrics. It also lets you establish a baseline – the beginning of your SEO story –
with which you can measure progress, performance and level of quality against your marketing initiatives.
By allowing you to assess your strengths against competitors and take steps to maintain your advantages by
spotting areas of opportunity where you can make improvements, benchmarking can serve as a wake-up call to
drive your team towards your objectives. When your marketing managers and partners know and understand
the current strengths and weaknesses of your digital programs, they focus more on effecting changes.
2. Data Aggregation – the ability to combine multiple data sources for a single source of truth
To tell truthful stories about SEO performance, you need a single source of truth – fed by an aggregation of
multiple data sources. Most companies have multiple technology stacks producing great volumes of data, but
boiling that information down requires the ability to integrate it easily.
Information may include:
Analytics data. It’s hard to overestimate the importance of analytics in evaluating site performance to uncover hidden patterns, correlations and other insights.
Sales and conversion data. Looping sales data back into your analytics systems provides huge insights into how to best optimize campaign performance, while sales data tells the story of your overall win rate – important information in motivating teams and persuading executives.
Business intelligence dashboards and analytics visualizations.
This data may include information on traffic rank, conversions, revenue and total content performance.
3. Clarity: The ability to bring the most important information to the surface
Data can be overwhelming. For many business leaders, SEO data can be prohibitively complex and difficult
to digest. Your SEO dashboard must be able to distinguish useful and informative data from interesting but
extraneous information and disseminate this into a clearly presented and easily digestible story.
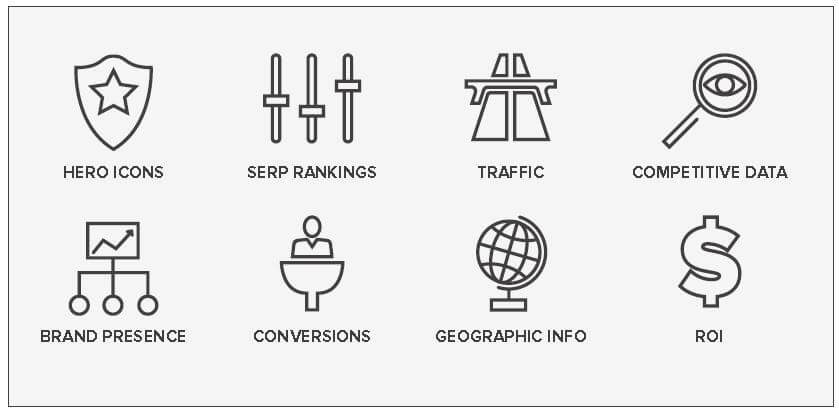
This can be achieved by using scorecards that deliver the most important information, graphical icons that
communicate major messages quickly and easy-to-read charts and tables that highlight only the most salient
detail. Dashboards are able to tell better stories by eliminating clutter and chaos and ultimately providing clarity
to your SEO programs and content performance
What a great dashboard succeeds in delivering:
• Puts the critical SEO metrics up front in a highly digestible form
• Highlights success and outlines story
• Provides success-based sound bites
When creating reporting dashboards, we use what we call the “hero image” or scorecard view, providing a high-level
view of results. This style of reporting quickly answers the “How are we doing?” question.
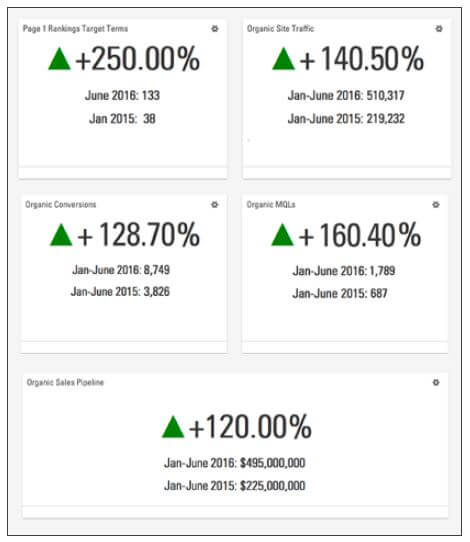
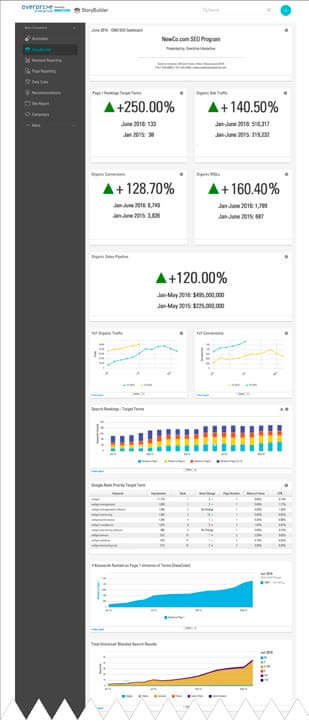
For example, the following “hero,” or scorecard, image (square with green up arrow), shows the vast
improvement in SEO rankings between June 2016 and the benchmark of January 2015.
“Perfection is achieved, not when there
is nothing more to add, but when there
is nothing left to take away.”
– ANTOINE DE SAINT-EXUPERY
The ultimate SEO dashboard is a storytelling tool
CMOs and VPs of marketing are challenged daily to communicate the success of marketing initiatives, improve
performance against key performance indicator (KPI) goals and motivate teams to support these goals and
initiatives. The key is to develop a storytelling mindset, which is much easier to achieve when using the right
SEO dashboard.
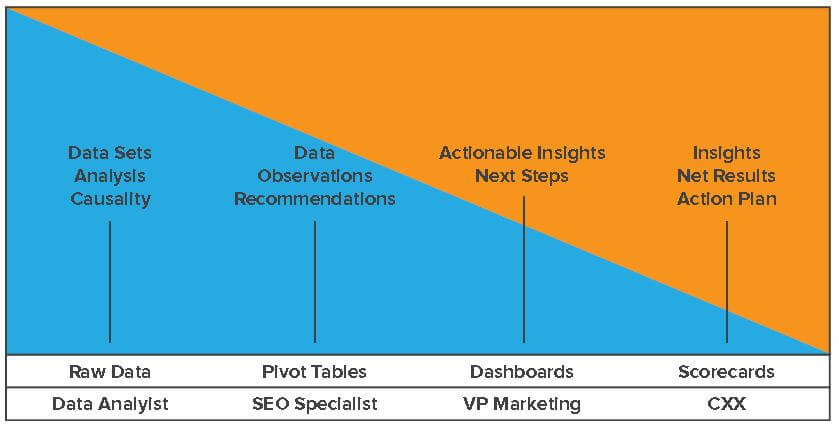
An SEO story moves beyond data to interpretation
When championing SEO efforts in order to secure support within your organization, you want to tell the story of
how you achieved your results and how these results are benefiting the organization.
These stories should include:
1. Data and data sets 6. Observations
2. Analysis 7. Recommendations
3. Causality 8. Net results
4. Insights 9. Action plan
5. Actionable insights 10. Next steps
VALUE MATRIX BY LEVEL
Building the ultimate SEO dashboard
While every SEO dashboard is unique, there are several things every effective dashboard must provide.
Clean design
Less is more when it comes to creating an SEO dashboard. The more information you pack into each screen, the
less likely it will be that users can effectively absorb and digest those stories, reducing the effectiveness of your
dashboard.
Comprehensive metrics
The ultimate SEO dashboard should provide quick access to key performance metrics while delivering the flexibility
to tailor views to your specific needs. Metrics should provide fast answers and clear stories around your
business questions as they relate to organic search and the resultant business performance.
Key dashboard ingredients
In the following example we use dashboard elements from BrightEdge, Overdrive Interactive’s SEO measurement
and analytics platform of choice, to illustrate what ingredients make up the Ultimate SEO Dashboard for CMOs.
The dashboard outline and layout
“How are we doing?”
Data source: The image to the right is known as a hero image. This image instantly provides clear answers to two major marketing questions important to CMOs:
1. Are we doing better than last year?
2. Are our SEO investments paying off?
The data to produce this hero image is customizable and updated manually by your SEO analyst. Other charts within your dashboard can be populated using BrightEdge Connect, which integrates with your major web analytics solutions, including Google Analytics, Coremetrics, Webtrends, and Adobe SiteCatalyst (Omniture).
Story: The SEO program has been tremendously successful. Core target keyword rankings have grown almost
250%, driving almost 140% growth in organic traffic. Organic conversions have risen over 128%, producing 160%
increase in marketing-qualified leads (MQLs). In addition, year-to-date (YTD) pipeline sales from organic are up
an astounding 120%. SEO is by far the single more cost-effective driver of incremental traffic and lead growth for
the organization.
In the graphic to the right, year-over-year data shows growth across organic terms, site traffic, conversions marketing qualified leads (MQLs) and continued organic pipeline growth. While these views provide the year-over-year performance at the macro level, the graphic below shows how you can also drill down into the micro month-over-month data set, allowing you to compare performance by month.
“Are we ranking for our target terms?”
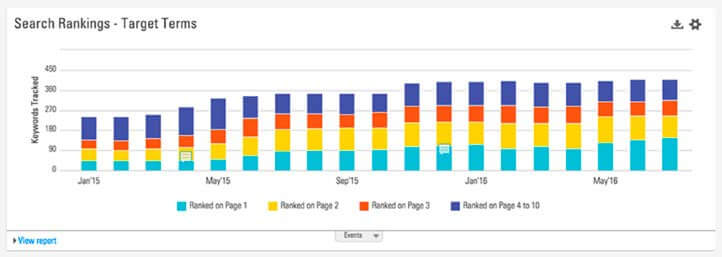
Data source: The above chart shows keyword rankings and tracked keywords displayed on NewCo’s dashboard
in page bands for terms ranked on pages 1, 2, 3 and 4-10. BrightEdge can track individual terms or keyword
groups and growth for core target terms.
Story: NewCo’s SEO program and its associated content development efforts have provided significant growth
in NewCo’s page-one rankings. These page-one rankings have in turn driven significant growth in traffic and
qualified leads. Based on the success of NewCo’s content development efforts, further rounds of content development have been built into the SEO roadmap.
“Are we ranking for our target terms?”
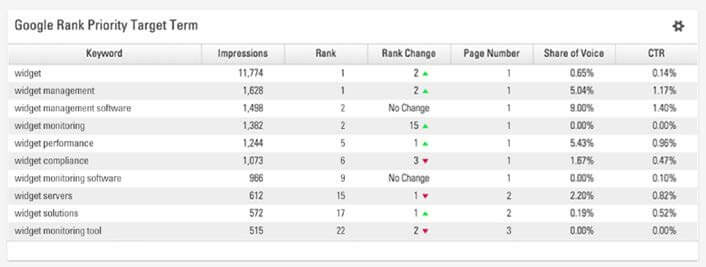
Data source: Every company has a short list of priority terms various stakeholders care about and vocalize concern
for. This table shows your tracked priority search terms, impression levels, rankings, ranking page number, share of
voice (SOV) and click-through rates by utilizing a combination of data sources and sets, including Google Search
Console and your web analytics package, all brought together by BrightEdge. The SOV column combines your overall search presence from an impression level and your ranking terms, which ultimately drive traffic back to your site and is a good indication of brand presence.
Story: As you can see, five terms are ranking high within the top terms. Three priority terms are still on page two and three and require immediate resources and attention. Moving ahead, focus resources on maintaining the five terms already in good positions and add resources to the five terms that require attention, especially the three not ranking on page one.
“Are we growing our brand?”
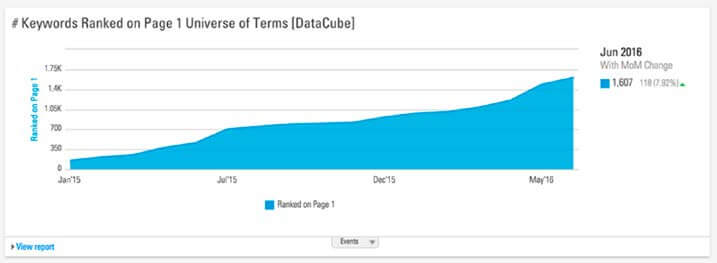
Data source: Growing a company’s brand in search means looking at not just your target terms but also the
broader universe of terms used by the public in relation to your company, your brand and your products.
BrightEdge’s database lets you track and visualize your presence and growth across the thousands of terms
you may not be actively optimizing against or monitoring. It shows your brand’s overall presence in the Google
index. The data in the chart above is yielded from the BrightEdge Data Cube, which consists of search results
from its database of millions of terms.
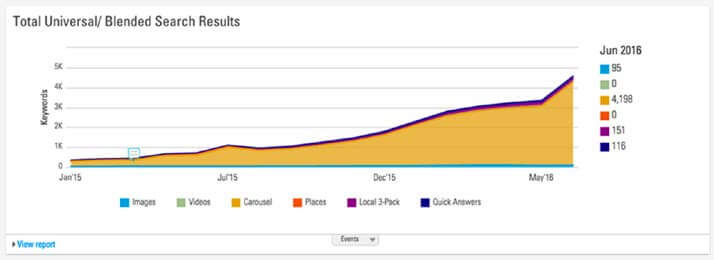
Story: The SEO tactics and content NewCo has been developing are not only helping core target terms but
are also influencing related keywords, driving more rankings across thousands of non-monitored search terms
and driving more traffic. Growth has been seen in NewCo’s page-one listings across all terms monitored by the
Data Cube, as well as universal results. As a result, NewCo’s traffic and brand presence have been significantly
increased across the entire industry category of search results.
“Are we beating the competition?”
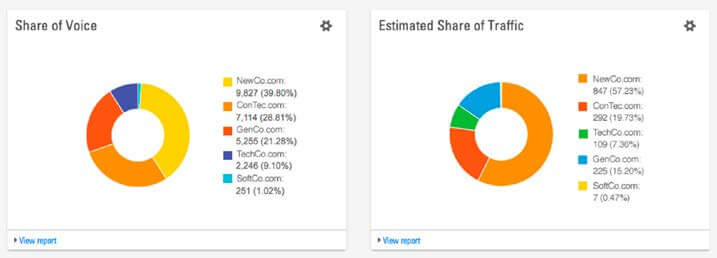
Data source: SOV and share of traffic help identify your standing and how you are dominating the SERPs and
driving traffic in comparison to your competitors, both locally and globally. These can also tell you whether you
are controlling the market share for your space.
SOV is the percentage of all online content, rankings and impressions for your company compared to your
competitors. Important factors include ranking for tracked keywords and search volume. SOV in search is similar
to keyword ranking: click-through rate drops by about half for each position between first, second, third and
fourth position.
Story: NewCo’s share of voice is 39.8% with an estimated share of traffic at 57.23%. Both are doing well based
on the competition; however, there is always room to grow and data from NewCo’s total universe of the 500
terms being monitored and targeted indicates more upside to be gained through investment in the SEO program.
“Are we growing revenue?”
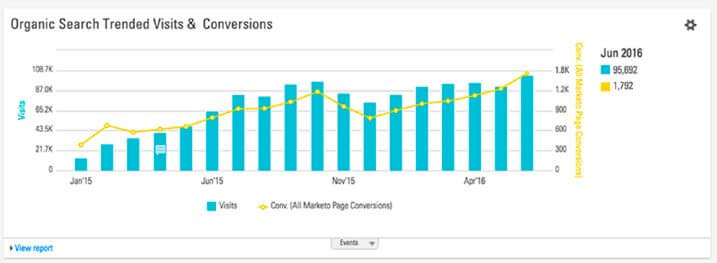
Data source: The BrightEdge platform allows users to integrate website analytics and conversion data from most
analytics platforms, including Google Analytics. The above chart shows NewCo’s growth in both organic website
traffic and conversions, as yielded by Google Analytics.
Story: NewCo’s organic traffic and conversions have grown in lockstep with its growth in organic search rankings.
November and December seasonality appears to play a role in traffic and conversion levels, but this is common in
NewCo’s category. The rise in conversions indicates that the SEO has changed the composition of NewCo’s overall
site traffic, resulting in a higher percentage of active buyers of NewCo’s products.
Overdrive recommends continuing with an aggressive SEO program and moving faster with its site-wide conversion
optimization recommendations.
“How are we doing in Germany?” (or any other market of concern)
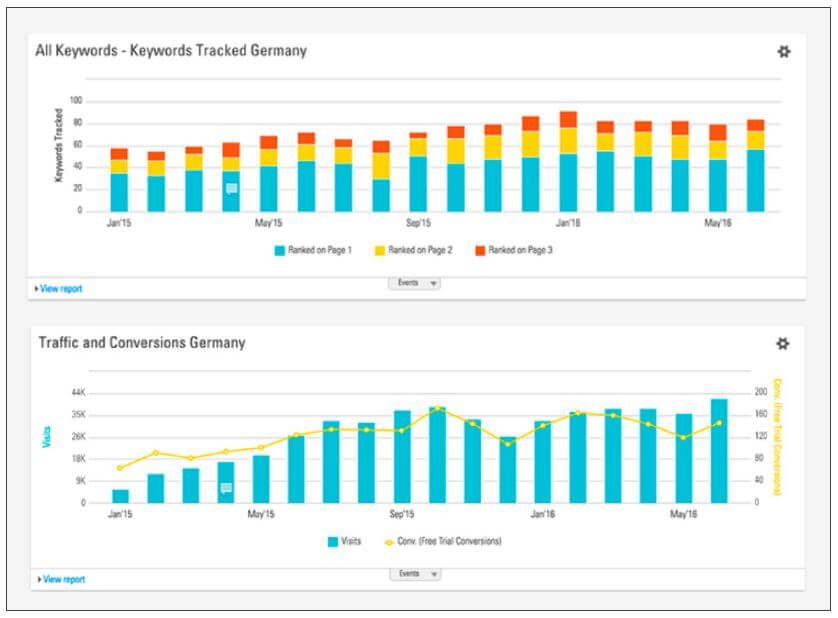
Data source: In addition to site-wide and worldwide results, BrightEdge and the CMO dashboard can display
results on local geographies. In this case, NewCo has made significant efforts to roll out its products and SEO
programs in Germany. The above charts show NewCo’s search rankings, traffic growth and conversions in and
from the German market.
Story: The German site launch and localized German SEO program have yielded significant results for NewCo in
its expansion into the German market. The site’s ever-increasing volume of German traffic and leads has fed the
German sales team and added significant pipeline value.
“How can we do better?”
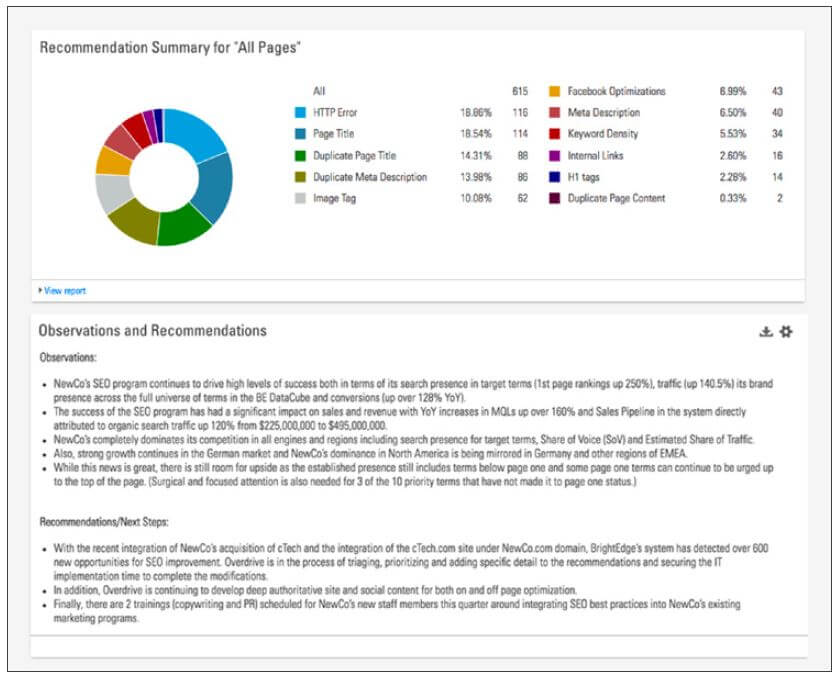
Data source: The above charts are created using both BrightEdge’s recommendation engine, which looks at various
areas of improvement on the page level, and Overdrive’s general observations and recommendations as made by
SEO analysts. As new content and site changes are made and Google’s algorithm evolves, new recommendations
are constantly being generated, requiring immediate attention from and prioritization by your SEO team.
Story: Based on the merging of NewCo’s acquisition of CTech, BrightEdge and Overdrive’s SEO analysts have
detected over 600 areas of improvement that will further generate success in the coming months. As acquisitions
appear to be occurring on a more frequent basis, SEO activities specific to these site merges should be standardized
for rapid triaging of SEO improvement opportunities.
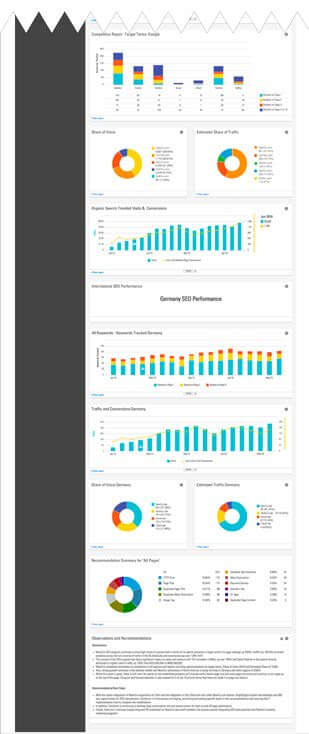
Bringing it all together:
The Ultimate SEO Dashboard for CMOs


