In today’s competitive digital landscape, efficiently managing media programs and generating high-quality leads are essential functions to ensure a robust sales pipeline. A comprehensive business intelligence platform serves as a critical tool in this endeavor, providing a centralized analytics solution for monitoring, analyzing, and optimizing media performance. By integrating data from various sources and presenting it in an intuitive format, a well-designed dashboard enables marketers to make informed decisions, identify trends, and adjust strategies in real-time or near-real time. This ensures that lead generation efforts are highly targeted and effective, driving better business outcomes through business intelligence solutions.
Several key considerations are involved in crafting a BI platform for lead generation programs, including data pipeline integration and modeling, front-end design, and interface development.
Data Integration and Pipeline Development:
Comprehensive Data Integration
A successful dashboard seamlessly integrates data from multiple sources, including paid search, paid social, online media platforms, and CRM systems. This provides a holistic view of media performance and lead generation metrics, enabling a comprehensive campaign effectiveness analysis through digital analytics.
Example: A comprehensive dashboard might integrate data from Google Ads, Facebook Ads, and a CRM system like Salesforce to provide a unified view of campaign performance, lead acquisition, and customer engagement.
Frequent Data Updates
In the dynamic realm of digital advertising, access to up-to-date data is critical. A dashboard capable of real-time or near-real-time updates ensures that the latest performance metrics are always available. This enables timely adjustments to campaigns and strategies based on current data, thereby optimizing outcomes.
Example: A real-time dashboard might display the current cost per acquisition (CPA) for each campaign, allowing marketers to monitor performance fluctuations and make immediate adjustments if necessary.
Integration with CRM Systems
Integrating CRM data into your dashboard is essential for measuring post-form-fill events and website engagement. This allows tracking the entire lead lifecycle, from initial contact to conversion, providing insights into lead quality and long-term engagement. Storing snapshots of CRM data over time can enable additional learnings as prospects are escalated through the sales funnel from marketing qualified leads to sales qualified leads, to customers.
Example: A dashboard integrated with a CRM system might track the number of leads generated by each marketing channel, the conversion rate of those leads into customers, and the average customer lifetime value.
Cross-Channel Attribution
Understanding the contribution of each digital channel to lead generation is vital for optimizing media spend. A robust dashboard should feature cross-channel attribution models that accurately attribute leads and conversions to the appropriate touchpoints, facilitating informed decision-making.
Example: A multi-touch attribution model might assign credit to multiple channels involved in a customer’s journey, such as a search ad that initially drove awareness, a social media post that fostered engagement, and an email campaign that ultimately led to a conversion.
Security and Data Privacy
Ensuring data security and privacy is paramount. Implementing robust security measures, such as data encryption, user authentication, and access controls, will protect sensitive information and maintain client trust.
Example: A dashboard might use strong encryption to protect data in transit and at rest and require users to authenticate with a username and password to access sensitive information.
Data Governance and Compliance
Implementing data governance practices ensures data quality, accuracy, and compliance with regulations (e.g., GDPR, CCPA). Establishing policies for data management ensures legal compliance and protects sensitive information.
Example: Conduct regular data audits to identify inaccuracies and use strong encryption to protect data.
Data Visualization and Front-End Platform Development:
User-Friendly Interface
A user-friendly interface allows stakeholders at all levels to effortlessly access and interpret data. Dashboards should incorporate clear visualizations, such as charts, graphs, and heat maps, to highlight key performance indicators (KPIs) without overwhelming users. By presenting data intuitively, stakeholders can quickly grasp insights and make informed decisions using a business intelligence platform. Some critical end-user considerations include:
-
- Ensuring users easily access the dashboard and use all the filters throughout the dashboard environment, regardless of their technical skills
- Maintaining a consistent design for buttons and fonts throughout the experience
- Ensuring that users don’t have to wait too long for the dashboard to load or for filters to be applied
- Utilizing larger fonts, unique colors, or well-designed indicator panels to highlight the key data points in a view
- Enabling a simple and straightforward design that does not overwhelm or confuse users
- Ensuring the data fits nicely to the screen, or the layout is responsive to allow for consumption on various devices and screen widths
- Including automated labels confirming the dates data sets were updated
- Implementing multiple filters to compare data points across multiple time periods
Example: A well-designed dashboard might use a color-coded heat map to visually represent the performance of different digital channels. Warmer colors indicate higher performance, and cooler colors indicate lower performance, allowing for quick identification of top-performing channels and areas that require attention.
Customizable Metrics and KPIs
Given the unique goals and priorities of different campaigns and clients, a dashboard should offer customizable metrics and KPIs tailored to specific lead generation objectives. This flexibility ensures that the dashboard remains relevant and valuable across various campaigns, providing actionable insights that align with distinct objectives in marketing analytics.
Example: A dashboard for a B2B lead generation campaign might prioritize metrics like website traffic, lead quality, and conversion rates. In contrast, a consumer product-focused dashboard may emphasize click-through rates, cost per click, and return on ad spend.
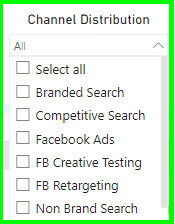
Segmentation and Filtering Capabilities
To derive actionable insights, it’s important to segment and filter data based on various criteria, such as demographics, geographic locations, and campaign parameters. These capabilities enable deeper analysis and help identify trends and patterns that can inform strategy adjustments.
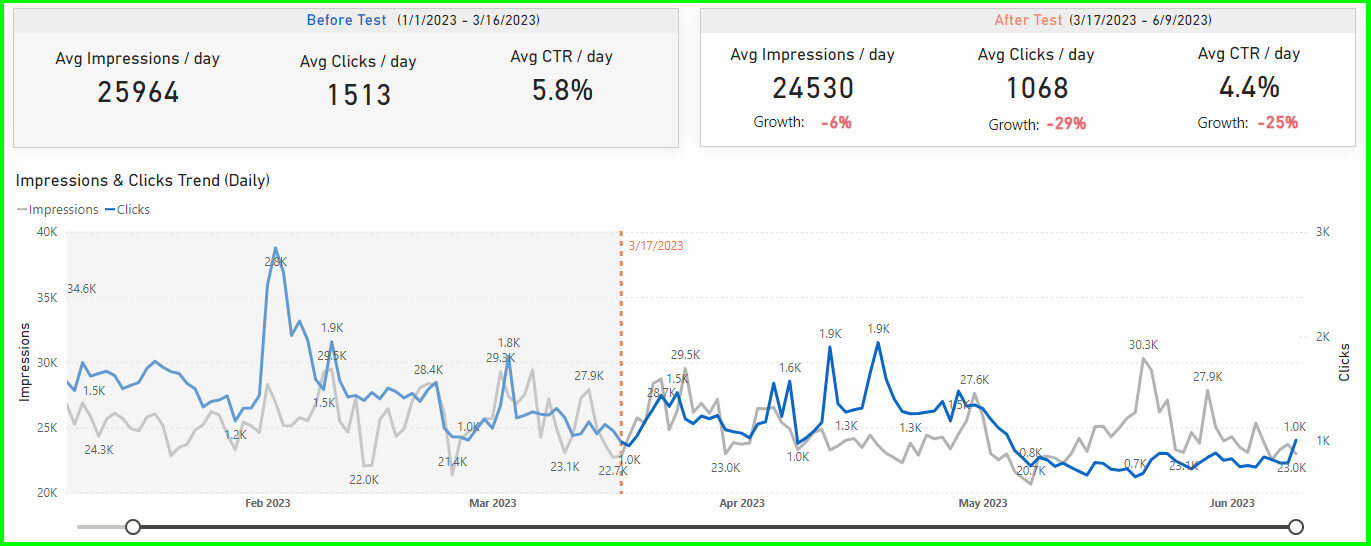
Example: A dashboard might allow users to filter data by geographic location to identify markets with the highest conversion rates. Similarly, analytics platforms should have many predefined comparison time periods to normalize seasonality, and allow for several time comparisons like year-over-year, quarter to date vs. prior year, month over month, etc.
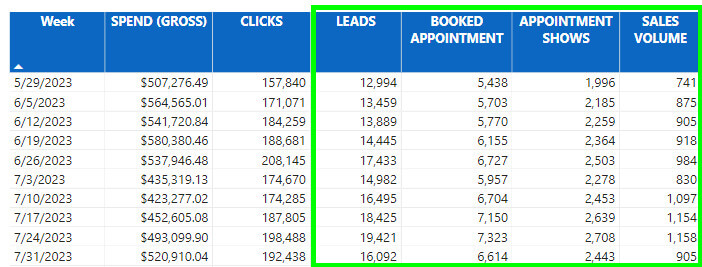
Data Visualization and Reporting
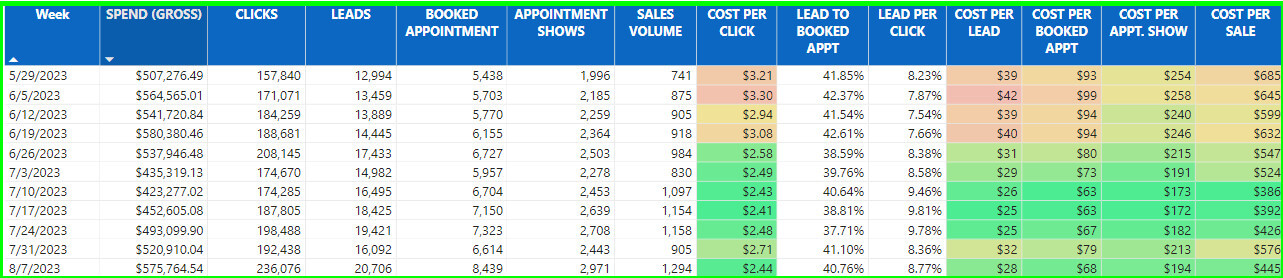
Effective data visualization transforms complex data sets into easily understandable insights. Dashboards should offer a variety of visualization options, such as line charts, bar graphs, scatter plots, and more. Automated reporting features can also save time and ensure consistent communication of performance metrics to stakeholders. Additional insights can often be gained by exploring data with time series motion charts to visualize changes in performance over time.
Example: An automated report might be scheduled to send a weekly email to key stakeholders, summarizing the top-performing campaigns, key metrics, and any areas that require attention.
Performance Benchmarks and Comparisons
Benchmarking performance against industry standards and historical data is crucial for contextualizing results. Your dashboard should provide benchmarking tools that allow comparisons with past campaigns, industry averages (when available), and competitor performance.
Example: A dashboard might compare the current campaign’s click-through rate to the industry average for similar campaigns, providing a benchmark for performance evaluation.
Advanced Analytics and Predictive Modeling
Incorporating advanced analytics techniques like predictive modeling and cohort analysis can uncover deeper insights and forecast future trends. These capabilities enable a more nuanced understanding of data, facilitating strategic decision-making.
Example: Use predictive modeling to identify potential churn risks based on customer behavior data and implement targeted retention strategies.
Mobile Optimization
Ensuring that the dashboard is fully optimized for mobile devices enables stakeholders to access and analyze data from anywhere. A responsive design that adjusts to different screen sizes and provides intuitive navigation is essential for mobile accessibility.
Example: Design a responsive interface that automatically adjusts to different screen sizes and provides intuitive navigation for mobile users.
A/B Testing and Experimentation Measurement
Incorporating A/B testing measurement capabilities allows for experimentation with different messaging, targeting, and creative elements to identify the most effective strategies. This data-driven approach to optimization ensures that campaigns are continually refined for better performance.
Example: Test different ad variations to determine which creative elements drive the highest click-through rates and conversions.
Future-Proofing the Dashboard
To remain effective long-term, dashboards should adapt to industry trends and emerging technologies. Incorporating AI and machine learning can automate data analysis, identify patterns, and provide predictive insights.
Example: Explore AI’s potential to automate data analysis tasks and offer predictive insights that guide strategic decisions.
Business Intelligence Platform Frequently Asked Questions
- What are business intelligence solutions?
Business intelligence solutions refer to technologies and strategies used to collect, analyze, and present business data for informed decision-making.
- How can a business intelligence platform help in media performance tracking?
A business intelligence platform integrates data from various sources, visualizes it in an accessible format, and allows for real-time tracking of key performance indicators (KPIs), optimizing media performance.
- What is the role of marketing analytics in lead generation dashboards?
Marketing analytics helps track and analyze marketing campaign data, allowing marketers to identify successful strategies, optimize media spend, and improve lead generation efforts.
- How do digital analytics contribute to dashboard effectiveness?
Digital analytics provide detailed insights into user behavior, helping marketers refine campaigns, measure performance across channels, and adjust strategies based on real-time data.
- What are some security features that dashboards should have?
Dashboards should have data encryption, user authentication, and access control mechanisms to ensure data privacy and protection.
- How do lead generation dashboards improve marketing efficiency?
Lead generation dashboards provide real-time insights into campaign performance, allowing marketers to adjust strategies quickly and optimize media spend, leading to more efficient and effective marketing efforts.
- What metrics should I include in a lead generation dashboard?
In addition to core media KPIS like impressions, clicks, and costs, additional key metrics include cost per acquisition (CPA), cost per lead (CPL) lead conversion rates, return on ad spend (ROAS), and lead quality. Customizable metrics based on campaign goals are also essential.
- Can lead generation dashboards track cross-channel performance?
Yes, lead generation dashboards can integrate data from multiple digital channels (e.g., social media, search engines, email marketing) to provide a holistic view of performance and ensure accurate cross-channel attribution.
- How can segmentation in dashboards help improve lead generation?
Segmentation allows marketers to filter and analyze data based on demographics, geography, behavior, or campaign parameters. This helps identify the most effective audience segments and improves targeting strategies.
- What role does automation play in lead generation dashboards?
Automation streamlines the process of data collection, reporting, and campaign management, ensuring consistent tracking of performance metrics. It also allows for timely optimizations and reduces manual work for marketers.
Explore Overdrive’s mQuantify Business Intelligence Platform
mQuantify is a leading-edge business intelligence platform designed to help businesses harness the full potential of their marketing data. This powerful analytics platform consolidates performance metrics from Google Ads, Salesforce, and other digital channels, creating clear, actionable dashboards that highlight key trends and opportunities.
Whether you’re seeking to optimize your campaigns or improve customer engagement, mQuantify provides an integrated data analytics platform that offers in-depth insights into your marketing performance. Its data visualization tools make complex information easy to understand, helping you make data-driven decisions faster.